Main menu
You are here
Statistics: Publications supported by Cineca
Here You can found statistics about:
data from Web of Science
PUBLICATIONS SUPPORTED BY CINECA |
|
Font: Web of Science - https://www.webofscience.com/ |
|
Search: (FT=Cineca or FO=Cineca) and (PY=2021 or PY=2022) Publications found: 1'028 |
|
Timespan: 2008-2022 Publications found: 6'001 |

 |
| Figure 1: Number of Publications (above) and Citations (below) from year 2008 to 2022 (2022 only January-October) (h-index 126; Average citations per item 23,62; Sum of Times Cited 141.768; Citing Articles 102.631) |
|
|
|
Figure 2: Journals in which Cineca users published most frequently |
 |
| Figure 3: Research areas of the publications |
 |
|
Figure 4: Nationalities of the organizations of authors |
 |
| Figure 5: Main organizations of the authors |
PUBLICATIONS SUPPORTED BY PRACE |
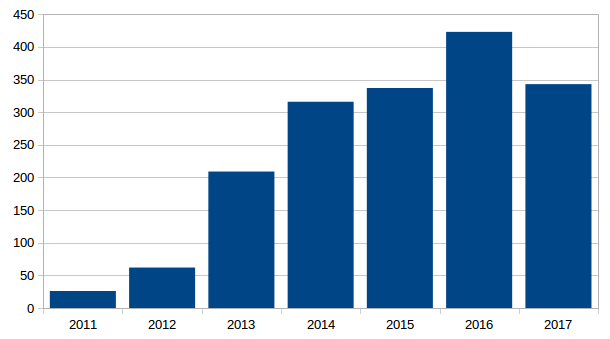
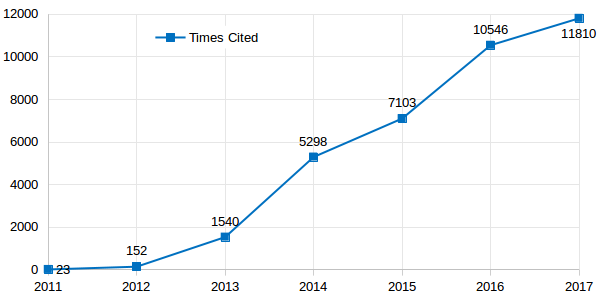
| Font: Web of Science - Thomson Reuters Database: Web of Science Core Collection Timespan: 2011-2017 Search: FT=PRACE or FO=PRACE Data: 8 Febrary 2018 Publications found: 1716 |
|
|
| Figure 6: Number of Publications and Citations from year 2011 to 2017 (h-index 75; Average citations per item 21.25; Sum of Times Cited 36472; Citing Articles 23762) |
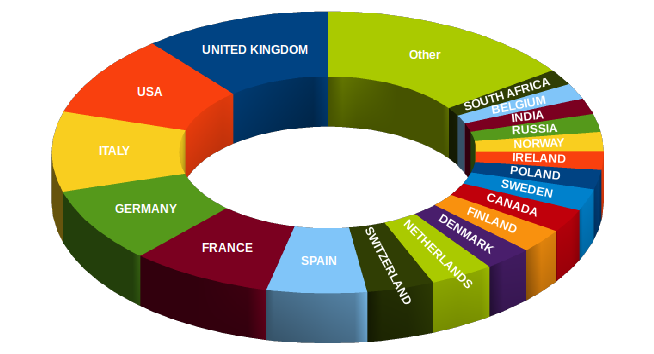 |
| Figure 7: Nationalities of the organizations of authors |
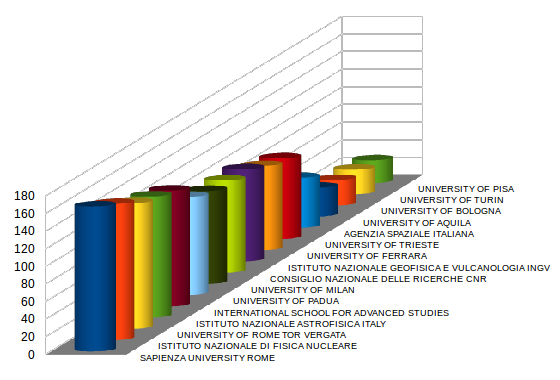 |
| Figure 8: Main Italian organizations of the authors |